As you all know, our colour vision works by exploiting three different spectral responses of the cone cells in the retina.

I found this picture somewhere, and although it gives the general idea, I am not sure how accurate it is. In particular I am not sure that the “colouring in” is right. We generally consider these spectral responses to peak at Red, Green and Blue. Note that the optics guys like to characterize light by its wavelength: not frequency so the hoizontal axis is the other way around from what we would normally expect in electronic engineering spectral work. It looks here (on my screen, anyway) that the S curve peaks in the black, and the L in the yellow. Anyway, we assign Red, Green and Blue to them and this is why we regard these as the “Primary Colours” (Not to be confused with the Cyan, Magenta and Yellow used by printers, or the approximations to them: Red Blue and Yellow used by artists.)
Those of us with a little schooling in how television works sometimes have trouble convincing our fellow TV viewers that there is no yellow light emanating from the television screen: particularly when a vivid yellow image is portrayed. Reference to the above graph might help, with the explanation that what we perceive as yellow is the condition in which the M and L cones are (roughly) equally stimulated. This can happen with narrow band spectral light (sodium vapour), or with a bimodal spectrum with a peak in the green and a peak in the red. I find it nicely intriguing that we cannot tell these apart.
If either of our M cones or our L cones are missing, or perhaps they are both there, but for some reason have identical receive spectra, then we have red/green colour blindness.
There is another phenomenon that arises from the way we generate our perception of yellow by comparing the signal strength of our Green (M) and Red (L) sensing cones.
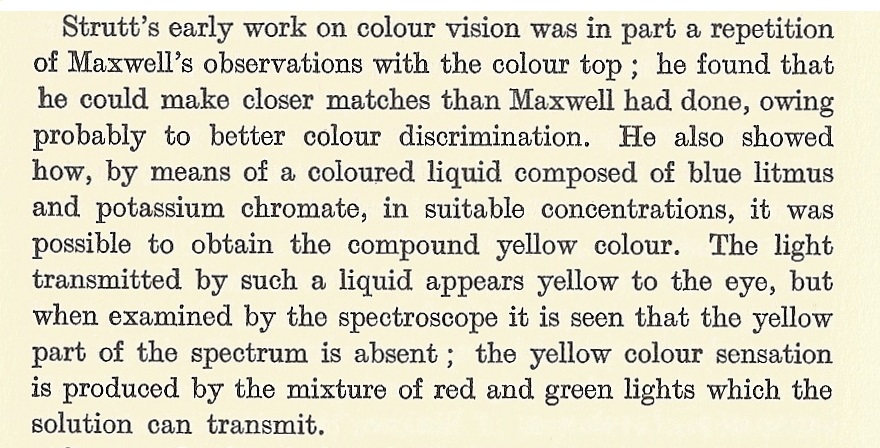
If we are presented with a spectrally pure red light, we see it as red (or, whatever we see it as, we have come to know that the name for it is red): similarly for spectrally pure green light. The intensity of the light has no bearing on the perceived colour. On the other hand, when we are subjected to light containing both red and green spectral lines, our perceived colour depends on the relative intensity of the two spectral lines.
If the relative sensitivity of the M and L cones varies from person to person, or perhaps the location of the spectral peaks of their sensitivity varies, then those effects will have little or no effect on the colour perception of red or green light, but will directly effect the colour perception of light containing both red and green lines.
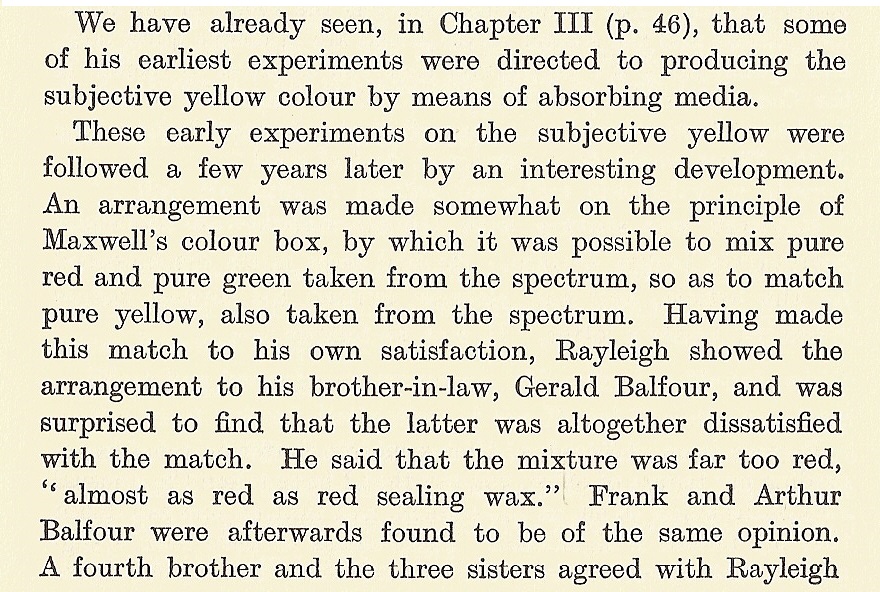
My first awareness of this arose when reading the biography of Lord Rayleigh. When I write “Lord Rayleigh”, I mean the 3rd baron Rayleigh. His surname was Strutt. My interest in him was sparked in the days when my primary work interest was acoustics. Rayleigh made many advances in that field. Rayleigh’s son wrote a biography of his father, which I have and which I read every few years. In his time, the son became Lord Rayleigh himself, but to avoid confusion, I will restrict the name to the 3rd baron.
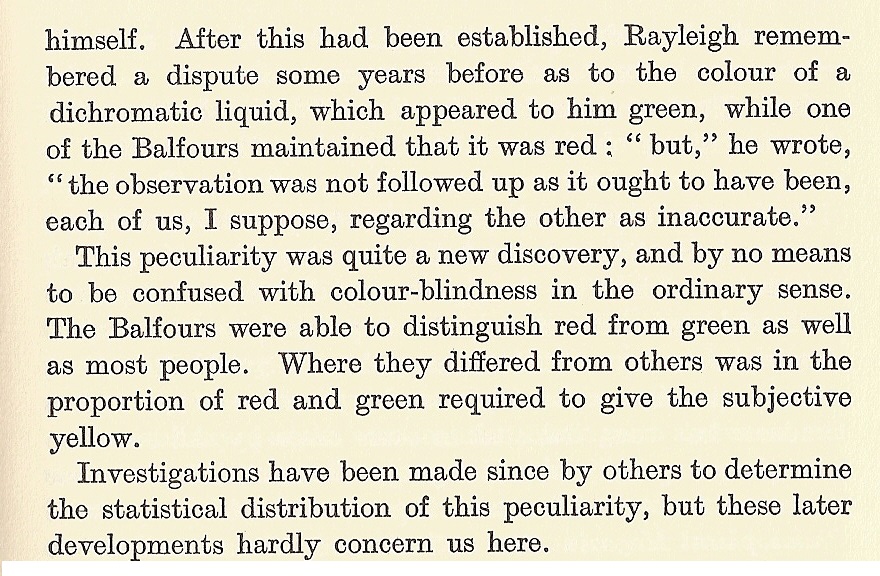
Rayleigh investigated red/green colour blindness (important because of the choice of red and green for railway signals) He made a significant observation (Page 46)
That this could be a “new” discovery may seem strange to those of us who are familiar with how colour television (or colour computer monitors) work, but here it is. No date given in the biography, but probably about 200 years after Newton’s work with a prism.
The fourth Baron was writing here as if the population (of people) could be divided into two groups, one of which had Lord Rayleigh as a member, and the other had the Balfours.
There is a delightful similarity here with Lord Rayleigh’s discovery of Argon. In an era when air was believed to consist of water vapour, carbon dioxide, oxygen and nitrogen, it followed naturally that nitrogen could be obtained by removing the other constituents from air. Rayleigh had set himself the task of weighing gasses, and he discovered that chemically produced nitrogen was lighter then nitrogen thus derived from the atmosphere. This led to the discovery that there was another gas present. This was produced by removing all the known constituents from air. What remained was named “Argon”. In the account of this discovery by his son, there is no mention of the possibility that this “Argon” might have more than one constituent.
Wikipedia says:

Lord Rayleigh’s Argon was mostly argon (99.7%), but it was 0.19% neon, 0.056% helium and 0.019% methane. You can’t really blame Lord Rayleigh for not noticing the others.
Similarly, Lord Rayleigh assumed that there were people with normal eyesight, and then one group (“this peculiarity”) (which included those Balfour brothers) which was different.
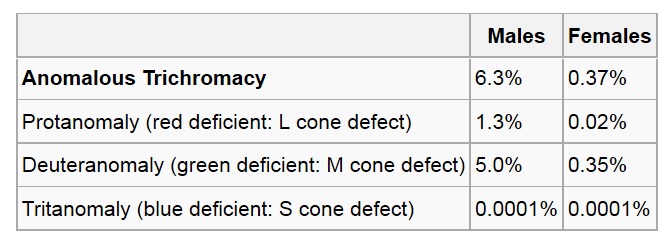
As with the argon, he was right to identify an anomaly, but wrong to assume that there was only one. The feature that Lord Rayleigh noticed in the Balfours is these days called Anomalous trichromacy. Wikipedia says:
Anomalous trichromacy is a common type of inherited color vision deficiency, occurring when one of the three cone pigments is altered in its spectral sensitivity. This results in an impairment, rather than loss, of trichromacy (normal three-dimensional color vision).
Protanomaly is a mild color vision defect in which an altered spectral sensitivity of red retinal receptors (closer to green receptor response) results in poor red–green hue discrimination. It is hereditary, sex-linked, and present in 1% of males.
Deuteranomaly, caused by a similar shift in the green retinal receptors, is by far the most common type of color vision deficiency, mildly affecting red–green hue discrimination in 5% of European males. It is hereditary and sex-linked.
Tritanomaly is a rare, hereditary color vision deficiency affecting blue–green and yellow–red/pink hue discrimination. Unlike most other forms, it is not sex-linked, it is related to Chromosome “7”.
Here is a summary of the frequencies of occurrence (not agreeing exactly with the above text.)
Two Consequences for us
Consequence 1.
Years ago, I was putting the finishing touches to a design that has three LEDs on the front panel. These were red, yellow and green. As the LEDs of different colours have different forward volt drops, one would never imagine that they would have the same value of series resistor. Factors of variation in LED brightness, and variations in the sensitivity of the human eye were to be considered as well. I had read Lord Rayleigh’s biography many years before, but did not think of it then. I selected the resistors to give much the same brightness to the three LEDs (to my eyes). I proudly submitted my work to my mate Tino Vescovi, who was my boss at that time. He asked why I had set the brightness of the three LEDs the way I had. I told him that I had set them for equal brightness. “No”, he exclaimed, “The brightnesses are so very different.” Tino changed the resistor values so that the brightnesses looked the same to him. They now looked very different to me. Unfortunately, I do not recall whether Tino’s changes made the red look brighter than the green or the other way around. I conclude that either Tino or I (or both) have anomalous trichromacy.
The lesson is, when you set the brightness of LED lamps like this, get a consensus of your work mates. Don’t rely on one person’s view. It is better to optimize your product for 96.665% of the population than the other 3.335%. You cannot get it right for everybody.
Consequence 2.
These days most people in the photography game are using digital equipment. They view their work on a computer monitor (often a very expensive “calibrated” one) which uses red, green blue primary colours. Then they print it out with a colour printer that uses cyan, magenta yellow and black inks.
No matter how well calibrated the monitors are, they cannot (even in principle) provide an image that will look the same as the printed one for 100% of the population. I suppose pleasing 96.665% is good enough. However it would be good if people whose profession is the presentation of colour understood this.
CIR Chromaticity Diagram
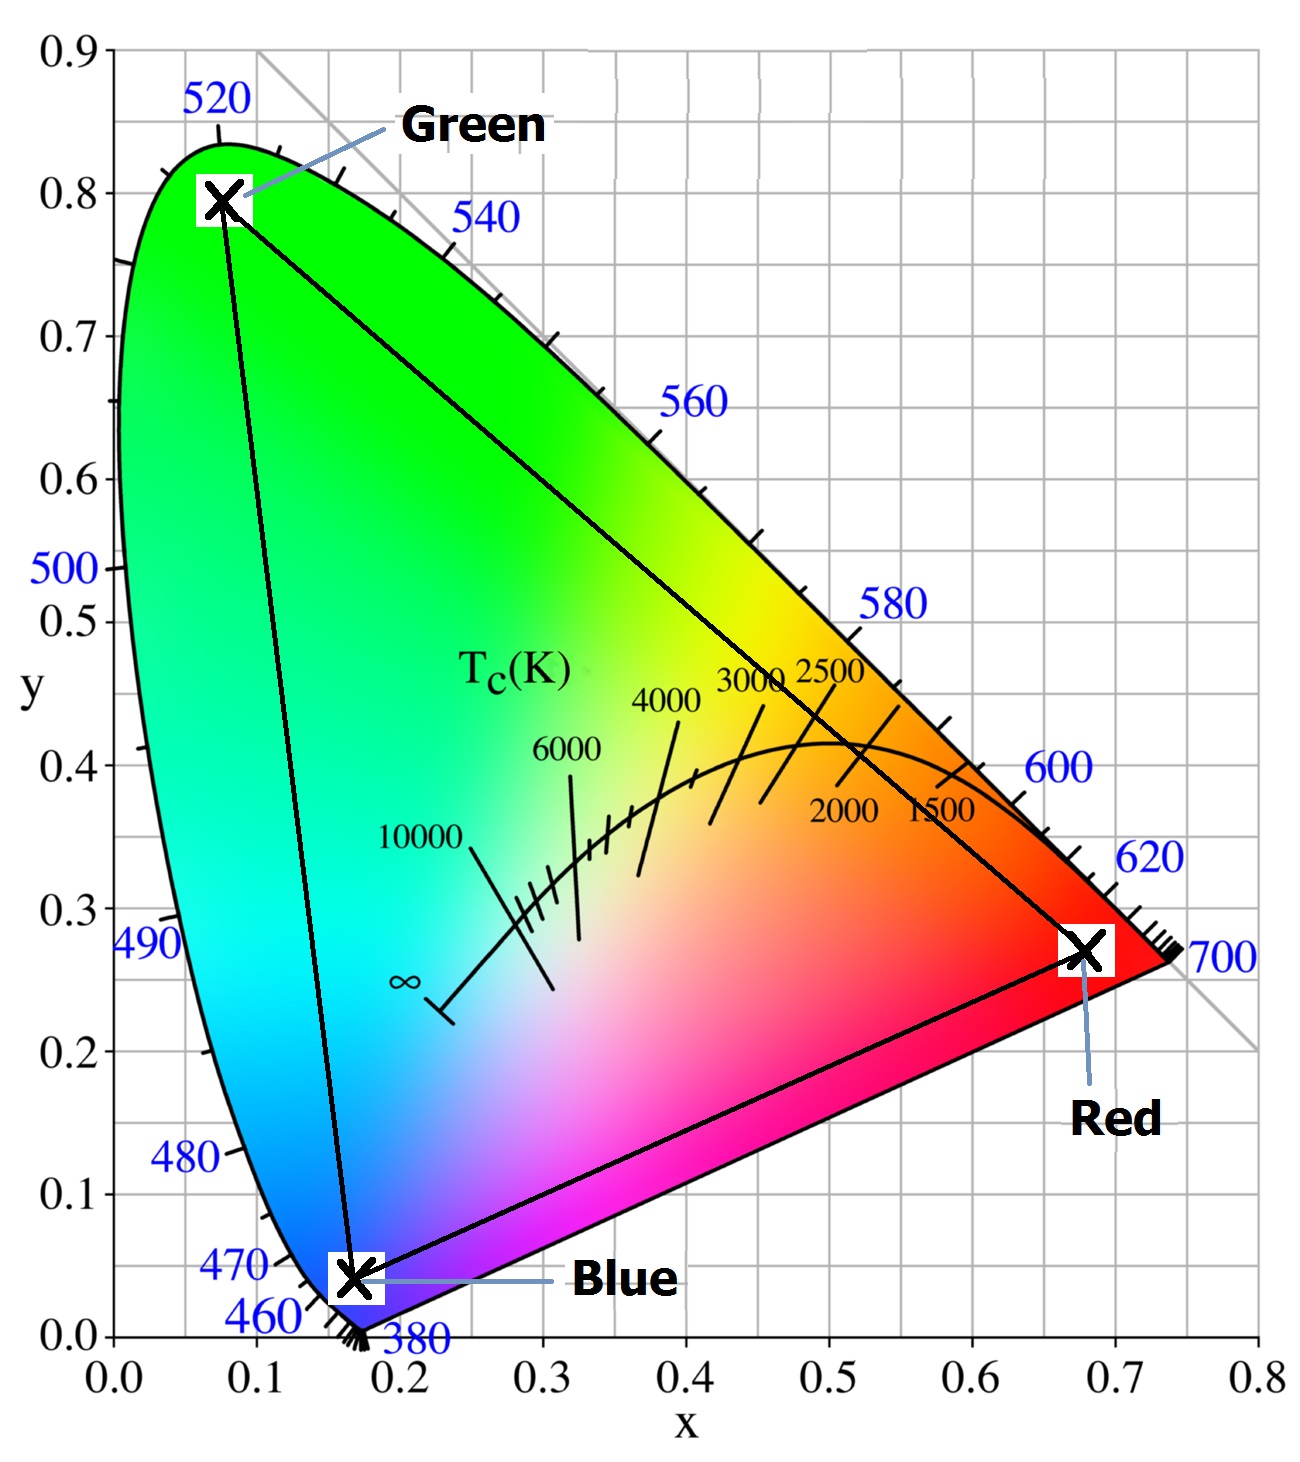
Somehow I love this. The diagram is presented as occupying x – y axes. Of course there is a z axis representing brightness. I have drawn in a triangle. I understand that if the screen has three phosphors (red, green and blue) then the colour on the screen can be any colour within the triangle.
Somehow the shape of the curve must follow from the spectral response curves of the S, M and L cones (first picture in this post). See http://en.wikipedia.org/wiki/CIE_1931_color_space
I wonder if it would be practical to use a similar “colour space” in other communication systems which used a three channel receiver with partly overlapping passbands. Hmmmmm!?